Figure 1.

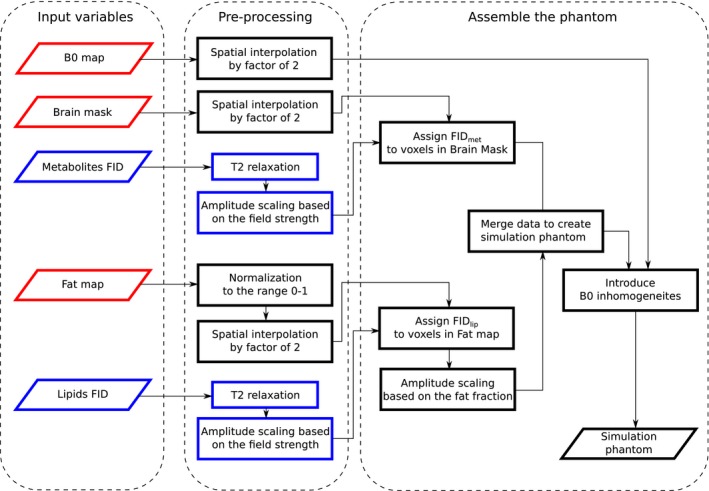
Flowchart of the creation of the simulation phantom from experimentally measured data. The red boxes indicate B 0‐dependent variables and/or steps and the blue boxes indicate volunteer‐independent data

Flowchart of the creation of the simulation phantom from experimentally measured data. The red boxes indicate B 0‐dependent variables and/or steps and the blue boxes indicate volunteer‐independent data