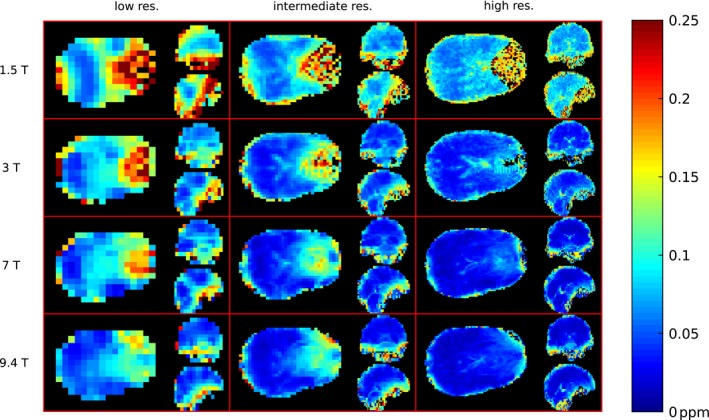
Figure 4.

FWHM maps of 1 representative volunteer. Orthogonal slices of the same locations are depicted for 3 different resolutions (rows) and 4 B 0 field strengths (columns). For every subplot the axial slice is depicted on the left side, the sagittal in the top right corner, and coronal in the bottom right corner
