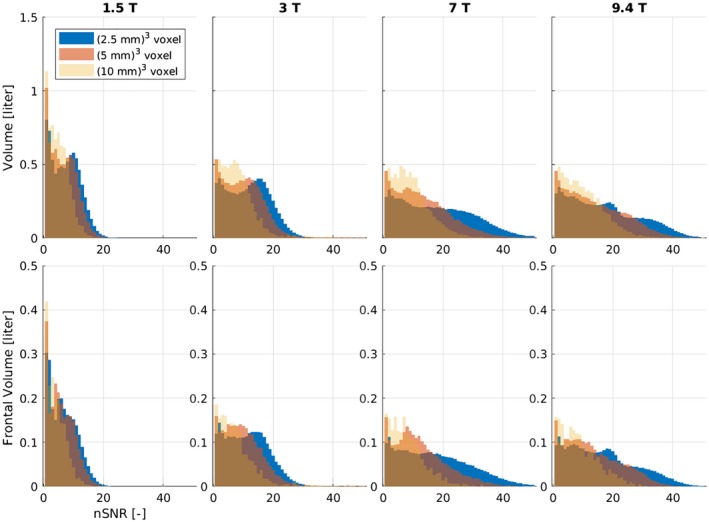
Figure 5.

Histograms of nSNR values for all 5 volunteers normalized to the volume covered. The top row depicts the results from the whole volume and the bottom row shows the results from the frontal lobe, which is most strongly affected by spatial ΔB 0. Every column represents 1 particular B 0
