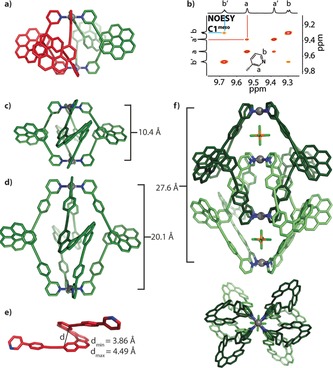
Figure 4.

a) DFT‐calculated structure of C1 meso. b) NOESY NMR detail of the C1 meso cage supporting the cis ligand arrangement. c, d) Calculated structures of C1 M and C2 M. e) One of twelve L2P molecules in the asymmetric unit of its solid‐state structure with the found minimum/maximum helical pitches. f) X‐ray crystal structure of DC2 M, side and top view along the Pd4 axis. Pd gray, N blue, C green (M enantiomer) and red (P enantiomer), P orange, F light green).
