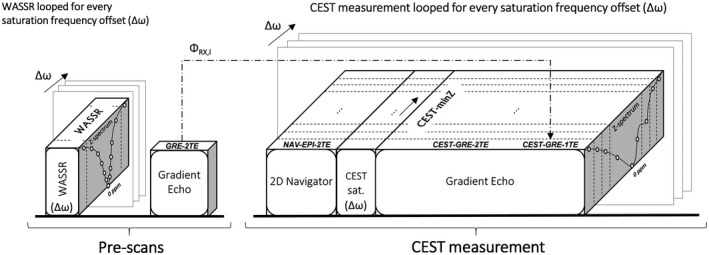
Figure 1.

An overview of the sequence scheme for prescans and CEST measurement. The name of each ∆B 0 mapping method appears on the top face of each block. The blocks represent image acquisition or labeling modules. The static correction methods WASSR and GRE‐2TE use only prescans (labeled correspondingly) to calculate ∆B 0 maps. The CEST measurement is composed of a multishot 2D EPI navigator scan with dual‐echo readout; a CEST preparation in which the saturation RF pulses are applied at a range of frequency offsets depicted in the frequency axis of the Z‐spectra; and a gradient‐echo with dual‐echo readout. Magnitude and phase images from the interleaved navigator are used by the dynamic method NAV‐EPI‐2TE to generate a set of ∆B 0 maps per ∆ω. In addition to their use for CEST quantification, CEST‐weighted images generated by the postlabeling gradient‐echo readout are used for self‐correction by three correction methods: 1) calculating one ∆B 0 map using the static method CEST‐minZ (from the averaged magnitude images at TE1 and TE2); 2) computing a ∆B 0 map for each ∆ω by the dynamic method CEST‐GRE‐2TE (from magnitude and phase images at echo times TE1 and TE2), and 3) calculating a ∆B 0 map for each ∆ω by the dynamic method CEST‐GRE‐1TE (from magnitude and phase images at only the first echo time TE1). Note that CEST‐GRE‐1TE requires phase offset maps per channel (ΦRX,I) from the GRE prescan (indicated by dotted arrow). CEST, chemical exchange saturation transfer; CEST‐GRE‐2TE, chemical exchange saturation transfer‐gradient echo readout‐2TE; NAV, navigator
