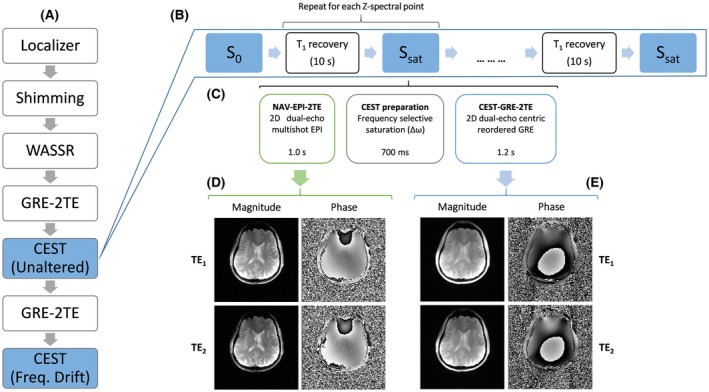
Figure 2.

An overview of the experimental protocol followed for the comparison of six ∆B 0 correction methods (A). Scheme of the CEST measurement (B), in which a delay for T1 recovery of water signal is interleaved with S 0 and S sat acquisitions, each of them consisting of three blocks (C): an EPI navigator with dual‐echo readout scan generating magnitude and phase images for each TE (D); a CEST labeling period in which the magnetization is saturated by a train of saturation pulses at a frequency offset ∆ω for each Z‐spectral point; and a GRE sequence with dual‐echo readout scan generating magnitude and phase images for each echo time (E). CEST, chemical exchange saturation transfer; EPI, echo planar imaging; GRE, gradient‐echo;WASSR, water saturation shift referencing
