Figure 4.

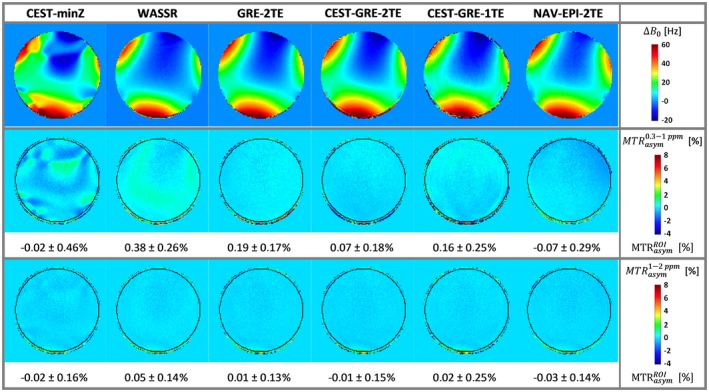
The ∆B 0 mapping accuracy in terms of MTRasym in a homogeneous phantom: The first row presents the color‐coded ∆B 0 maps determined by the static methods (CEST‐minZ, WASSR, and GRE‐2TE) and the first ∆B 0 map from the dynamic methods (CEST‐GRE‐1TE, CEST‐GRE‐2TE, and NAV‐EPI‐2TE). Below color‐coded maps of ∆ωB 0‐corrected MTRasym values are shown for the integration range ∆ω of ± [0.3–1.0] ppm (second row) and ±[1–2] ppm (third row). Values within the black circular delineated ROI are expressed as mean ± standard deviation. Accurate ∆ωB 0 correction is indicated by homogeneous MTRasym maps with low values, as the phantom containing no MTC or CEST agents should result in MTRasym = 0%. Methods GRE‐2TE and CEST‐GRE‐2TE provided the most accurate MTRasym values among static and dynamic methods with similar low spatial variability. CEST, chemical exchange saturation transfer; EPI, echoplanar imaging; GRE, gradient‐echo; MTC, magnetization transfer contrast; MTRasym, asymmetric magnetization transfer ratio; NAV, navigator; ROI, region of interest; WASSR, water saturation shift referencing
