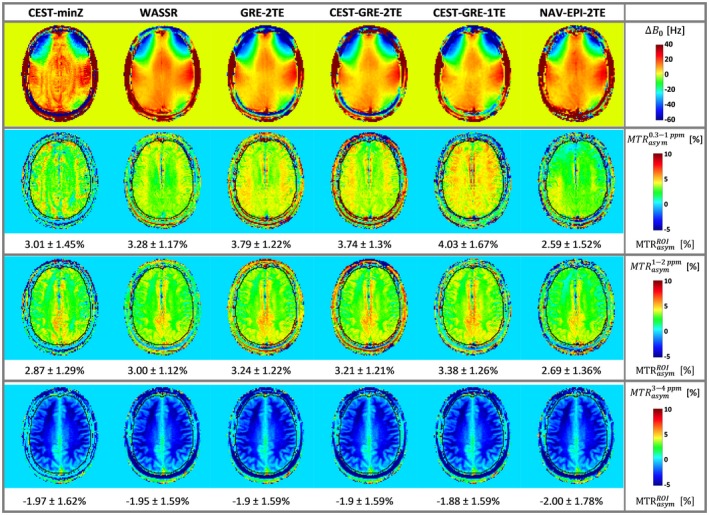
Figure 5.

Performance of each ∆B 0 correction method under unaltered conditions for volunteer V2: The first row shows the color‐coded ∆B 0 maps of the static correction methods (CEST‐minZ, WASSR, and GRE‐2TE) and the first ∆B 0 map from the dynamic methods (NAV‐EPI‐2TE, CEST‐GRE‐1TE, and CEST‐GRE‐2TE). Below, color‐coded maps of ∆B 0‐corrected MTRasym values for the frequency ranges |0.3–1.0|, |1–2|, and |3–4| ppm are displayed in the second, third, and fourth rows, respectively. The outline of the brain, defining voxels included in the mean MTRasym (see Section “Data analysis”), is indicated in black. The dynamic method CEST‐GRE‐1TE appears to estimate slightly lower B 0 compared to method CEST‐GRE‐2TE, producing a higher‐valued MTRasym map. The NAV‐EPI‐2TE shows the opposite effect (overestimation of B 0 compared to CEST‐GRE‐2TE) in the frontal region. CEST‐minZ, determination of the water resonance frequency from the Z‐spectrum; GRE‐2TE, MTRasym, gradient echo‐2TE‐asymmetric magnetization transfer ratio; NAV‐EPI‐2TE,navigator‐echoplanar imaging‐2TE; WASSR, water saturation shift referencing
