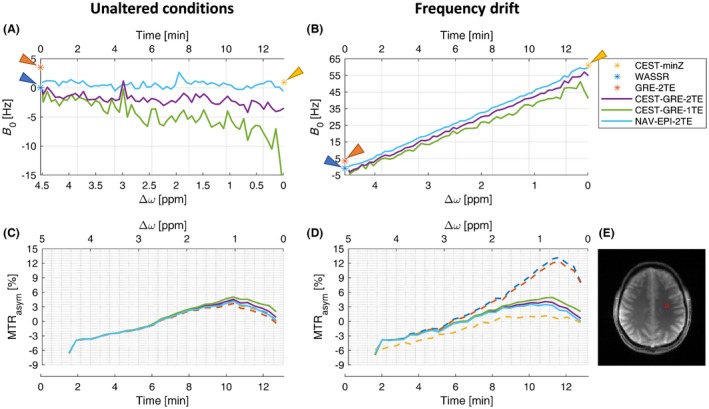
Figure 6.

Dynamic field mapping and its impact on the MTRasym within an ROI located in the white matter (WM) section of volunteer V3 (E). The ROI‐averaged B 0 estimation without (A) and with (B) an induced frequency drift of ~4.6 Hz/min. The static methods are represented by stars, while dynamic methods are depicted by solid lines. The times on the x axes are the times elapsed after the “GRE‐2TE” prescan. For illustration the time point of the WASSR acquisition was also set to t = 0. The offsets on the x axis ( ∆ω) refer to the frequencies at which saturation pulses were applied at the time instant when each B 0 sample was determined. Differences in MTRasym curves with different ∆B 0‐correction methods under unaltered (C) and drifted (D) conditions are shown in the bottom row. CEST‐GRE‐2TE (purple), CEST‐GRE‐1TE (green), and NAV‐EPI‐2TE (light blue) succeeded in mapping and correcting the induced drift ∆B 0(t). A good estimate for the precision of the B 0 mapping approaches can be derived from the standard deviation of the B 0 measurements in absence of an induced frequency drift (A). For CEST‐GRE‐2TE, assuming a Gaussian distribution, it can be stated that in 95% of all cases a B 0 change of ±1.92 Hz can be corrected. CEST‐GRE‐1TE, chemical exchange saturation transfer‐gradient echo‐1TE; MTRasym, asymmetric magnetization transfer ratio; NAV‐EPI‐2TE, navigator‐echoplaner imaging‐2TE; ROI, region of interest; WASSR, water saturation shift referencing
