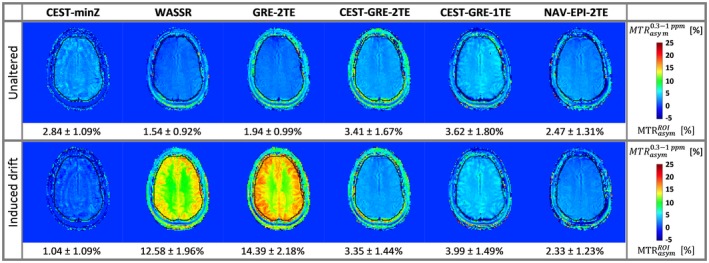
Figure 7.

Effect of a known linear frequency drift on the MTRasym maps of volunteer V4: The top row shows color‐coded maps for the different correction methods in unaltered conditions (an apparent drift of ~6 Hz was measured between the GRE‐2TE prescan and the CEST acquisition at ∆ω = ±1 ppm); the bottom row depicts maps for which a ~4.6‐Hz/min drift was induced. The static method CEST‐minZ overestimated B 0, resulting in decreased MTRasym values, while WASSR and GRE‐2TE show the opposite effect, since both scans were performed before the field drift was applied. Among the dynamic methods, CEST‐GRE‐2TE and NAV‐EPI‐2TE compensate for this drift most efficiently, providing very close MTRasym values within the delineated ROI (in black) between acquisitions, followed by CEST‐GRE‐1TE. CEST‐GRE‐2TE, chemical exchange saturation transfer‐gradient echo‐2TE; CEST‐minZ; determination of the water resonance frequency from the Z‐spectrum; MTRasym, asymmetric magnetization transfer ratio; NAV‐EPI‐2TE, navigator echoplanar imaging‐2TE; ROI, region of interest; WASSR, water saturation shift referencing
