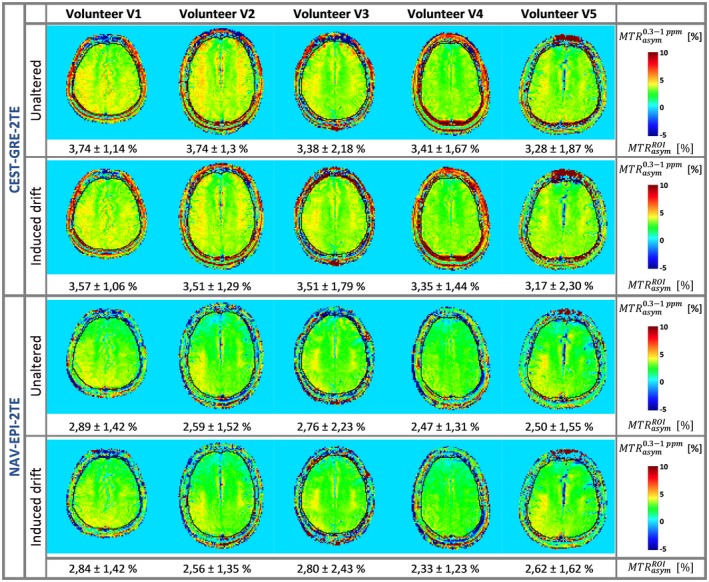
Figure 8.

Comparison of the correction performance of the proposed dynamic methods CEST‐GRE‐2TE (rows 1 and 2) and NAV‐EPI‐2TE (rows 3 and 4) for subjects V1‐V5: ∆B 0‐corrected MTRasym (0.3–1.0 ppm) maps in the absence (first and third rows) and in the presence (second and fourth rows) of the induced B 0 drift during each CEST measurement. A ROI along each volunteer's brain border was manually drawn (delineated in black) and the MTRasym mean ± standard deviation values within this ROI are shown at the bottom of each map. Among the dynamic methods, both CEST‐GRE‐2TE and NAV‐EPI‐2TE generated highly consistent MTRasym contrasts between scans in all cases. CEST‐GRE‐2TE, chemical exchange saturation transfer‐gradient echo‐2TE; MTRasym, asymmetric magnetization transfer ratio; NAV‐EPI‐2TE, navigator‐echoplanar imaging‐2TE
