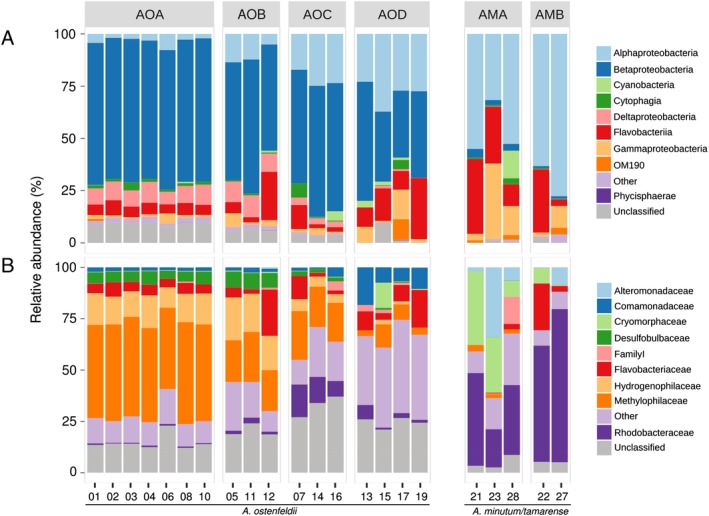
Figure 2.

Composition of microbiomes of Alexandrium isolates at (A) Class and (B) Family level. Samples are grouped by dissimilarity (Supporting Information Fig. S3); AOA‐D: A. ostenfeldii group A–D, AMA‐B: A. minutum/tamarense group A–B. The cultures were harvested during late exponential phase using 0.2 μm, 47 mm filters and DNA was extracted (Boström et al., 2004). The V3‐V4 region of the 16S rRNA gene was amplified using primers 341F (CCTACGGGNGGCWGCAG) and 805R (GACTACHVGGGTATCTAATCC) and sequenced using Illumina MiSeq (Herlemann et al., 2011; Hugerth et al., 2014). The read‐pairs were clustered into OTUs using Usearch v8.1 (radius 1.5) (Edgar, 2013) corresponding to ~97% sequence identity and singletons were removed (Supporting Information Table S2). OTUs were classified using SILVA db 123 SSURef NR99; (Quast et al., 2013) using SINA v. 1.2.13 (Pruesse et al., 2012). The graph was constructed using ggplot2 (v. 2.2.1) (Wickham, 2009). The numbers for each sample specify the ID of each strain given in Supporting Information Fig. S4. The sequence data have been submitted to the European Nucleotide Archive (ENA) database under accession numbers ERS1617530‐ERS1617557.
