
Figure 1.
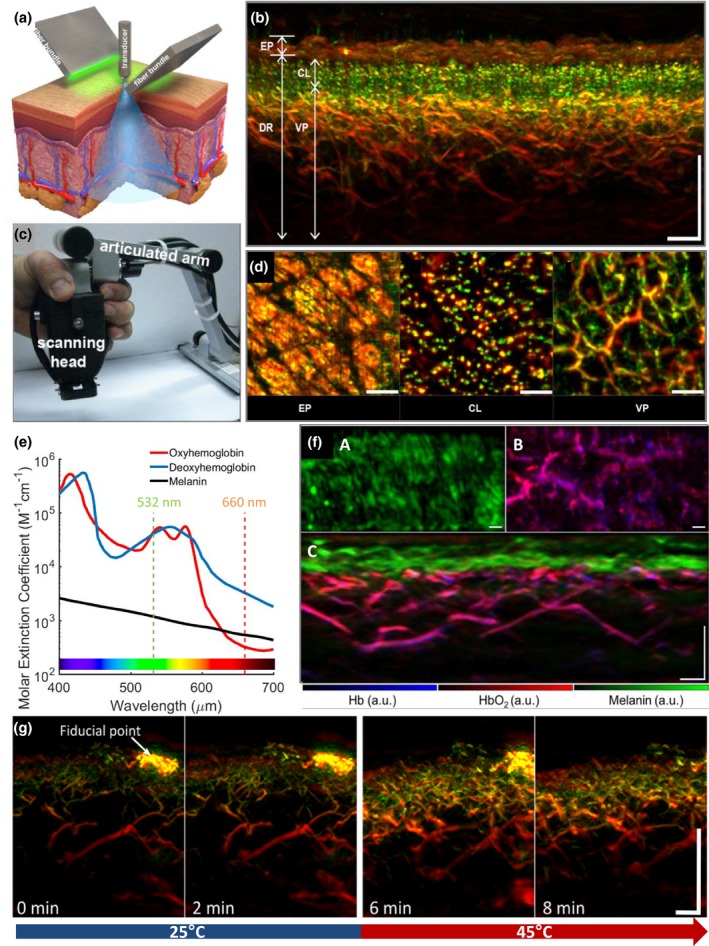
Raster‐scan optoacoustic mesoscopy (RSOM): illustration of the system and imaging of healthy skin. (a) Schematic illustration of an RSOM system, depicting the configuration of the ultrasound detector (transducer) and the illumination bundles. (b) RSOM images of healthy skin in transverse cross section. Smaller structures (e.g. small vessels) emit ultrasound signals rich in high‐frequency components (depicted in green); larger structures (e.g. larger vessels) emit signals rich in low‐frequency components (depicted in red). Scale bar, 500 μm. (c) Photograph of RSOM scanning head attached to an articulated arm. (d) RSOM images of skin layers in enface sections. CL, capillary loops; DR, dermis; EP, epidermis; VP, vascular plexus. Scale bar, 500 μm. (e) Absorption spectra of melanin, oxy‐ and deoxyhemoglobin as a function of the wavelength of the applied light. At 532 nm, the three chromophores absorb equally strongly and therefore emit equally intense optoacoustic signals. At 660 nm, the weaker absorption by oxy‐ and deoxyhemoglobin allows for largely selective imaging of the skin's melanin distribution. (f) Mapping of the distribution of melanin, oxy‐ and deoxyhemoglobin in human skin generated through unmixing of multispectral RSOM imaging: A, en face cross section through the epidermal layer; B, en face cross section through the dermal layer; and C, transverse cross section through the entire skin. Scale bar, 250 μm. (g) Transverse cross section of forearm skin before local heating (minutes 0 and 2) and after local heating (minutes 6 and 8) from 25 to 44°C. The heating causes reactive vasodilation. Scale bar, 500 μm. Panels a–d modified from Aguirre et al. (2017)33; panel e, modified from https://omlc.org/spectra/hemoglobin/; panel f, modified from Schwarz et al. (2016)61; and panel g, modified from Berezhnoi et al. (2018).63