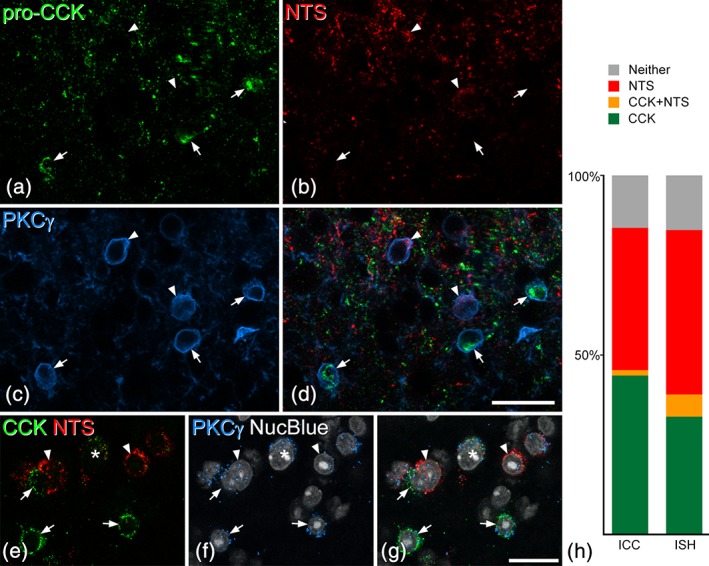
Figure 8.

The relationship of pro‐cholecystokinin (CCK) and neurotensin to protein kinase Cγ (PKCγ) in the dorsal horn. (a–c) A projection of three optical sections (1 μm z‐separation) through the lamina II‐III border region scanned to reveal immunoreactivity for pro‐CCK, neurotensin (NTS), and PKCγ. Cell bodies of five neurons with strong to moderate PKCγ staining are visible. (d) The merged image shows that two of these are neurotensin‐immunoreactive (arrowheads), while the other three are pro‐CCK‐immunoreactive (arrows). In each case, immunostaining for the neuropeptide/precursor can be seen in the perikaryal cytoplasm just inside the ring of PKCγ‐immunostaining, which represents the plasma membrane. (e–g) In situ hybridization in a section that had been reacted with probes for CCK, neurotensin, and PKCγ mRNAs and counterstained with NucBlue. Several PKCγ+ cells are present in this field, and six of these are marked. Three (arrows) are positive for CCK mRNA and two (arrowheads) for neurotensin mRNA, while one (asterisk) contains mRNAs for both CCK and neurotensin. The in situ hybridization images were obtained from a single optical section. (h) Quantitative analysis of the proportions of PKCγ cells that were positive for CCK and/or NTS detected with either immunocytochemistry (ICC) or in situ hybridization (ISH). The bar chart shows the results for cells with strong to moderate PKCγ‐immunoreactivity (ICC) or that had 10 or more Prkcg mRNA transcripts (ISH). In each case, these have been divided into those that were positive for CCK only (green), neurotensin only (red), or both CCK and neurotensin (orange). Cells that were negative for both peptides are represented as gray bars. In each case, data from three animals were pooled. Scale bars for (a–d) and for (e‐g) = 20 μm [Color figure can be viewed at wileyonlinelibrary.com]
