
Figure 2.
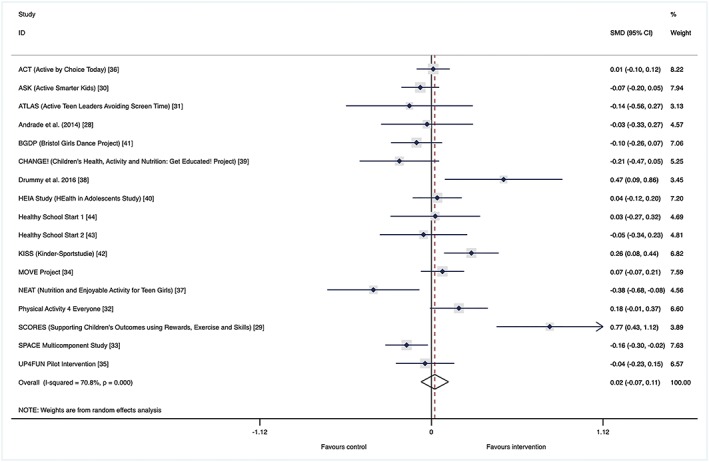
Main effect. Forest plot of standardized mean difference of change in physical activity between intervention and control groups of school‐based physical activity interventions (study name [reference]) [Colour figure can be viewed at wileyonlinelibrary.com]