
Figure 3.
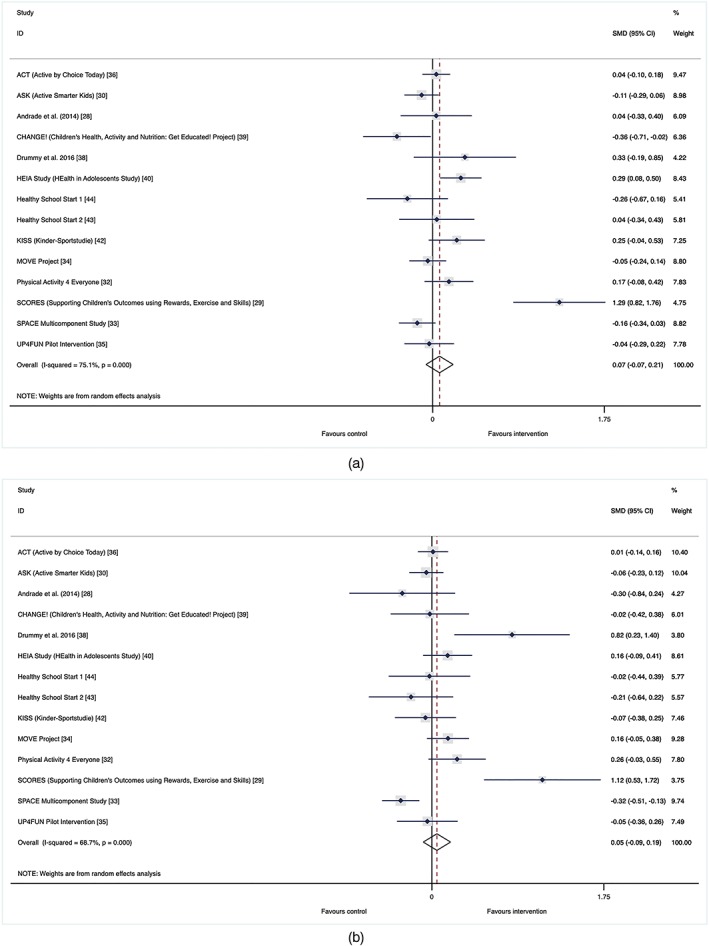
(a,b). Gender effect. Forest plots of standardized mean difference of change in physical activity for (a) girls and (b) boys between intervention and control groups of school‐based physical activity interventions (study name [reference]) [Colour figure can be viewed at wileyonlinelibrary.com]