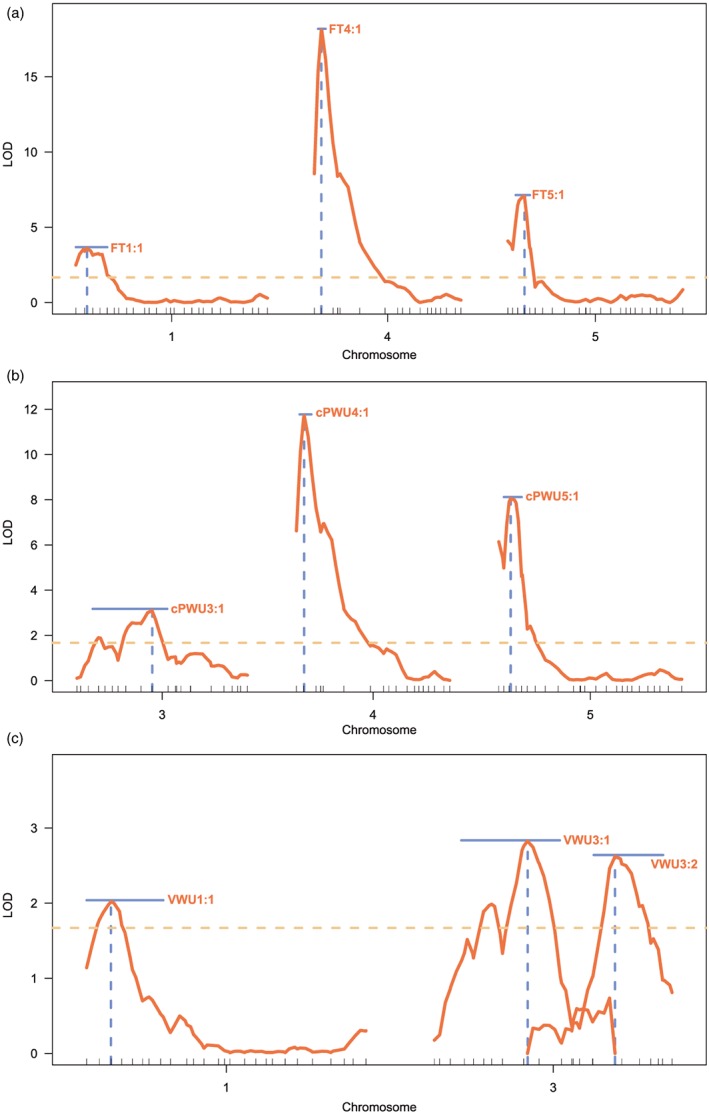
Figure 3.

Quantitative trait loci (QTL) mapping. Logarithm of the odd (LOD) profiles for whole chromosomes were significant QTL are located according to multiple QTL mapping. (a) LOD profiles for three significant QTLs underlying variation for flowering time, (b) LOD profiles for three significant QTLs underlying variation for calculated lifetime plant water‐use (cPWU), and (c) LOD profiles for three significant QTL underlying variation for vegetative water use (VWU). The light brown dashed horizontal line indicates the 10% significance threshold for QTL identification. The solid horizontal blue lines indicate the 95% Bayesian confidence intervals of the QTLs. The dashed vertical blue lines indicate the QTL positions on the genetic map [Colour figure can be viewed at wileyonlinelibrary.com]
