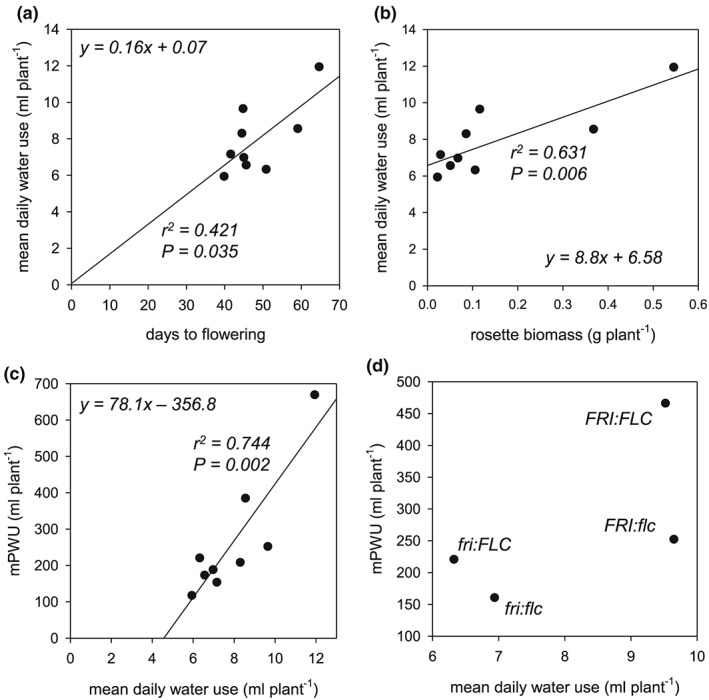
Figure 5.

The contribution of mean daily water use in the near‐isogenic lines. (a) Relationship between flowering time and mean daily water use, (b) relationship between rosette biomass and mean daily water use, (c) relationship between mean daily water use and measured plant water use (mPWU), and (d) relationship between mean daily water use and mPWU divided into four FRI/FLC allelic groups tested in the near‐isogenic lines. The linear model of the relationship between mean long‐term water use and mean daily water use is provided. R 2 and P values are provided where a significant relationship was identified
