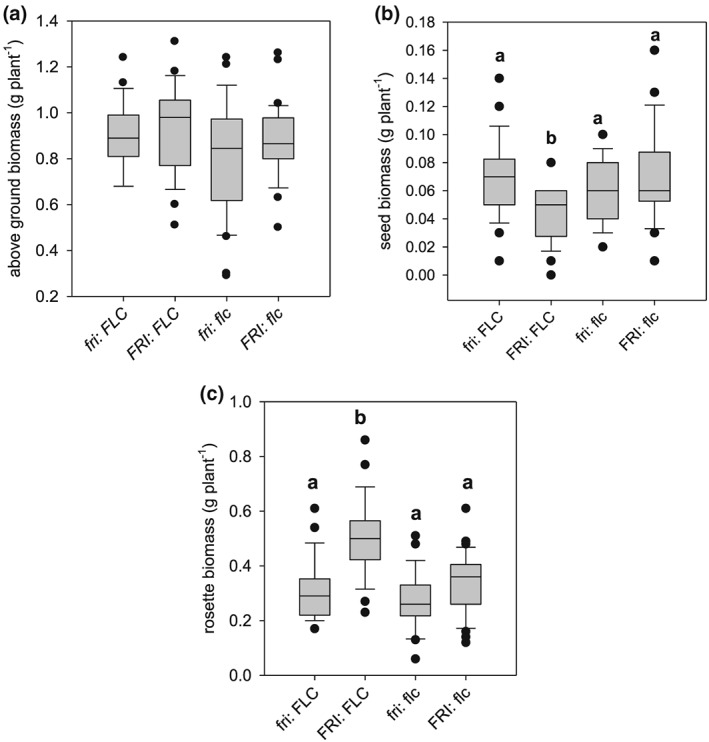
Figure 6.

Boxplots of biomass parameters based on allelic combinations of FRI/FLC in the recombinant inbred lines: (a) above ground biomass, (b) seed biomass, and (c) rosette biomass. The letters (a, b, and c) above the boxplot denote the post‐hoc Tukey groups, where allelic groups whose letters are different are significantly different from one another for that trait at P < 0.05. The bold line in the centre of the boxplots represents the median, the box edges represent the 25th (lower) and 75th (upper) percentiles, and the whiskers extend to the most extreme data points that are no more than 1.5x the length of the upper or lower segment. Outliers are data points that lie outside the 1.5x interquartile range both above the upper quartile and below the lower quartile
