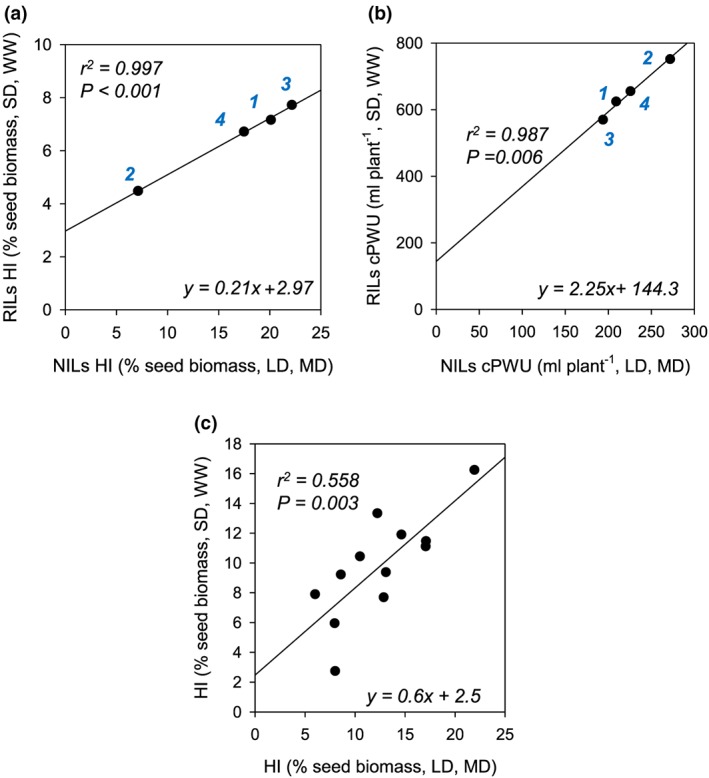
Figure 7.

Comparison of water use parameters and harvest index (HI) parameters across different growth and watering regimes. (a) Correlation of HI of the four FRI/FLC allelic groups tested in recombinant inbred lines (RILs) and near‐isogenic lines (NILs). RILs were subjected to the growth regime shown in Figure 1A (SD, WW), and NILs were subjected to growth regime shown in Figure 1B (LD, MD). (b) Correlation between cPWU and cPWU of the four FRI/FLC allelic groups tested in RILs and NILs grown under two different day length and watering regimes (SD, WW and LD, MD). (c) Correlation of HI of 12 ecotypes subjected to the growth different growth regimes shown in Figure 1. The lines represent the equation of the linear regression model. The P‐value of the slope parameter and adjusted R 2 value associated with the linear model are provided for each association. SD: short day; LD: long day; WW: well watered; MD: moderate drought. Allelic combinations: 1: fri/FLC; 2: FRI/FLC; 3: fri/flc; and 4: FRI/flc [Colour figure can be viewed at wileyonlinelibrary.com]
