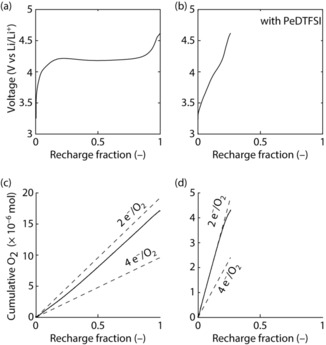
Figure 4.

a),b) Voltage profiles during recharge of Super P/PTFE (9/1, m/m) composite electrodes after discharge to 1000 mAh gC −1 at 100 mA gC −1 in O2 saturated 1 m LiTFSI/TEGDME without (a) and with 380 mm PeDTFSI (b). c),d) Cumulative O2 evolution in the cells in (a) and (b), respectively, as determined by measuring the pressure in the cell head space in comparison to the theoretical value based on current.
