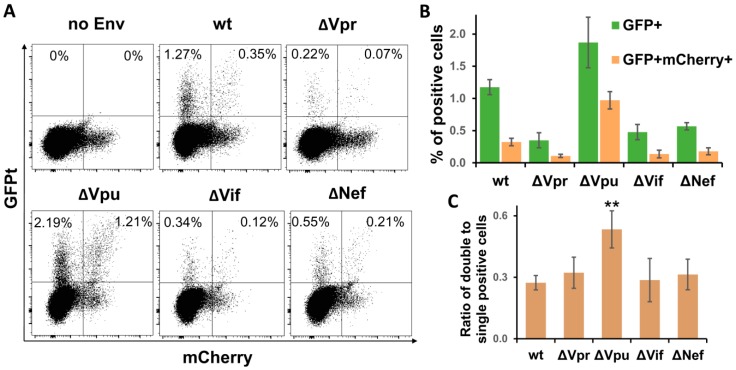
Figure 4.
Quantification of cells infected by wt or accessory gene mutant HIV-1 in Jurkat-Raji/CD4 cell coculture using inGFPt and inmCherry vectors. (A) Typical flow cytometry DotPlot graphs showing distribution of single- and double-infected cells at day 3 after cell mixture. Quantitative analysis of single infected (GFP+) and double infected (GFP+ mCherry+) cells (B) and their ratios as a measure of MOI (C). Data are presented as average values ± Std dev from three independent experiments. All values obtained for indicated mutants of HIV-1 in B are statistically different from wt control by Student’s t-test at p < 0.01. **, statistically different from the control (wt) at p < 0.01.

