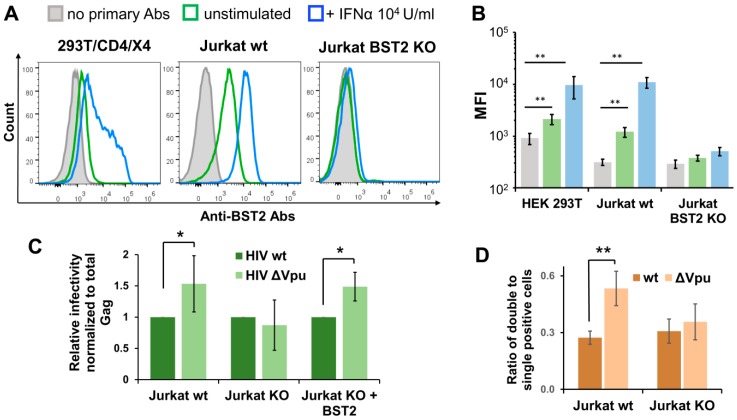
Figure 5.
BST2 knockout and replication of Vpu-deficient HIV-1. (A) Flow cytometry analysis of spontaneous and INF-α2b-induced BST2 expression on surfaces of indicated cells. The data are shown as the representative overlaid FACS histograms (A) and as the levels of mean fluorescence intensity (MFI) (B). The color codes in B match those in A. (C) The levels of wt and ∆Vpu HIV-1 replication in Jurkat-Raji/CD4 cell cocultures were comparably examined using parental Jurkat cells (left two bars), BST2 KO Jurkat cells (middle two bars), and BST2 KO Jurkat cells transiently cotransfected with BST2 expression plasmid (right two bars). The infectivity data were normalized to the levels of total Gag and the values obtained for HIV-1 ∆Vpu were calculated relative to the respective wt HIV-1 controls. (D) The levels of MOI detected with wt or KO Jurkat cells and calculated as described for Figure 4C. The results in B–D are representative of at least three independent experiments and shown as averages with standard deviations. *, **, data are statistically different at p < 0.05 and p < 0.01, respectively.

