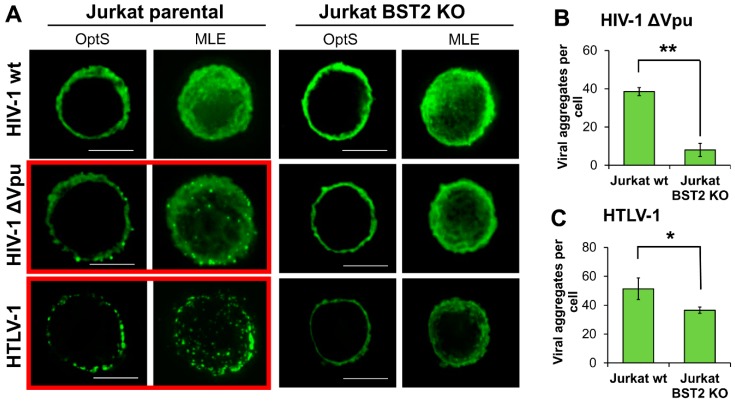
Figure 6.
The patterns of HIV-1 and HTLV-1 viral particle expression in BST2-positive and negative T cell lines. (A) Jurkat parental or KO cells were transfected with wt or Vpu(-) HIV-1 or HTLV-1 packaging plasmid and followed fixation/permeabilization stained with the respective anti-Gag Ab. Cells were analyzed using fluorescence deconvolution microscope, and presented as a 0.3-µm optical slices through the middle plane of cells (OptS) or as Z-stack one plane projections obtained by Maximum Likelihood Estimation (MLE) algorithm (scale bar, 5 μm). At least 4-6 cells per sample were analyzed to demonstrate representative cells. The levels of clusterization for HIV-1 ∆Vpu (B) and HTLV-1 (C) were quantified using ImageJ Threshold, Watershed, and Analyze particles software options. A size limit for clusters was set to calculate numbers of clusters per cell. The data obtained from several cells and from different slides were averaged and presented. * and **, the differences between wild type and KO cells are statistically significant at p < 0.05 and p < 0.01, respectively.

