Figure 1.
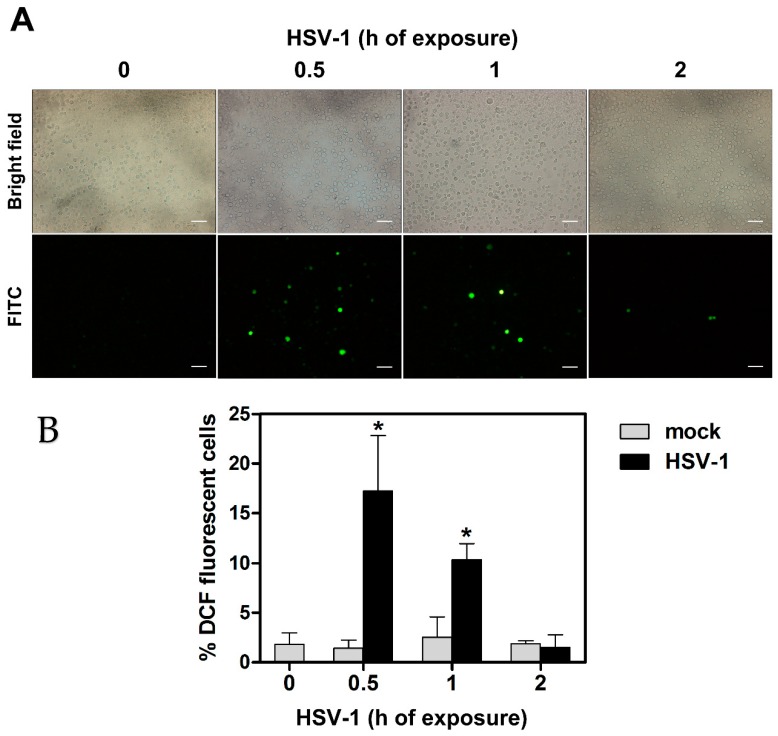
ROS production in U937 cells exposed to HSV-1. Cells were preloaded with DCFH-DA 10 µM before HSV-1 infection (MOI = 50 PFU/cell). At indicated times post virus exposure, ROS production was monitored by fluorescence microscopy. (A) Brightfield (total cells) and FITC channel (ROS positive cells) from representative images. 20× objective, scale bar = 50 μm. (B) % of DCF fluorescence positive cells (mean + S.D). Data were obtained from 6 frames randomly selected from three separate experiments (2 frames each). Digital images were captured by 40× or 63× objectives. * p < 0.001. vs control (h 0).

