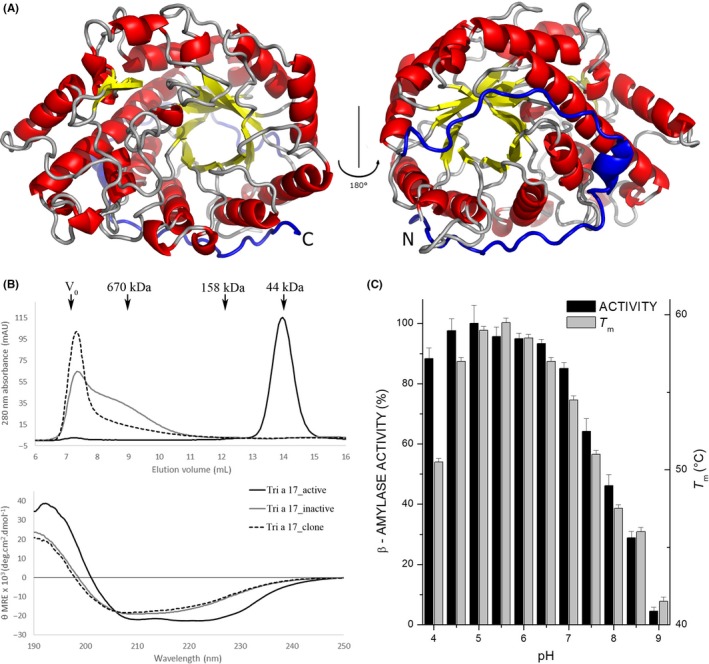
Figure 1.

A, Cartoon model of Tri a 17 showing the (β/α)8‐barrel architecture with its C‐terminal portion, which corresponds to the IgE‐reactive peptide, in blue. B, Size exclusion chromatography traces of the recombinant amylases, marker protein elution volumes, and void volume are shown with arrows (top). Circular dichroism analysis of recombinant β‐amylases. The spectra are expressed as mean residue ellipticities (θ‐MRE) (y‐axis) at given wavelengths (x‐axis) (bottom). C, Percent maximum activity of Tri a 17_active as a function of pH (black). Tri a 17_active melting temperatures (Tm) against pH as measured by DSF (gray). Data are averages of three independent measurements with error bars showing the standard deviation
