Figure 2.

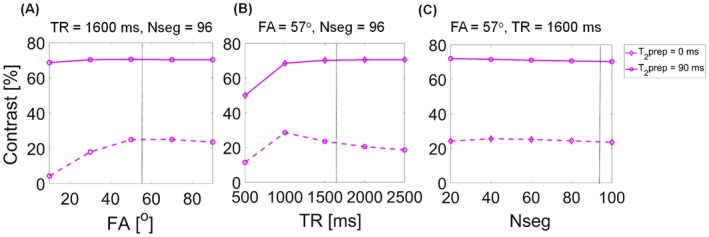
Simulated contrast between 2 representative tissues (healthy and cancerous prostate peripheral zone) as a function of acquisition parameters FA (A), TR (B), and Nseg (C)

Simulated contrast between 2 representative tissues (healthy and cancerous prostate peripheral zone) as a function of acquisition parameters FA (A), TR (B), and Nseg (C)