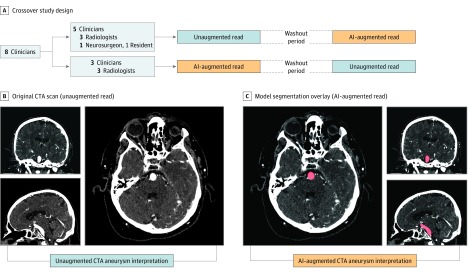
Figure 1. Study Design.
A, Crossover study design. Clinicians were divided into 2 groups to perform reads with and without model augmentation in random order, with a 2-week washout period between. B, Unaugmented read, with original CTA scan in axial, coronal, and sagittal view. C, Augmented read, with model segmentation overlay on CTA in axial, coronal, and sagittal view. Readers had the option to toggle overlays off and view the scan as shown in B. AI indicates artificial intelligence; CTA, computed tomographic angiography.

