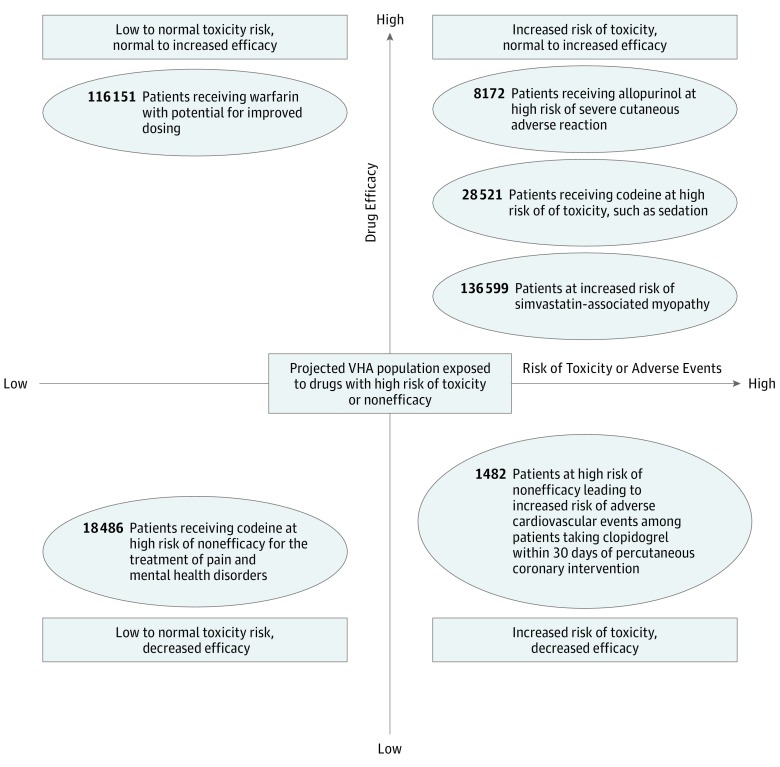
Figure 3. Projected Veterans Health Administration (VHA) Population Exposed to a Drug With High Risk of Toxic Effects or Nonefficacy from October 1, 2011, to September 30, 2017.
Medications with a strong level A recommendation to either avoid or adjust the dose based on available pharmacogenetic test results are included. The x-axis depicts the increasing risk of toxic effects or adverse drug reaction in response to drug exposure for patients with select phenotypes. The y-axis depicts the spectrum of anticipated efficacy of the drug for patients with select phenotypes—those with certain phenotypes are at higher risk of drug nonresponse. The number of patients projected to be carriers of the genetic variant or specific phenotype is based on the numbers of new drug recipients from October 1, 2011, to September 30, 2017.

