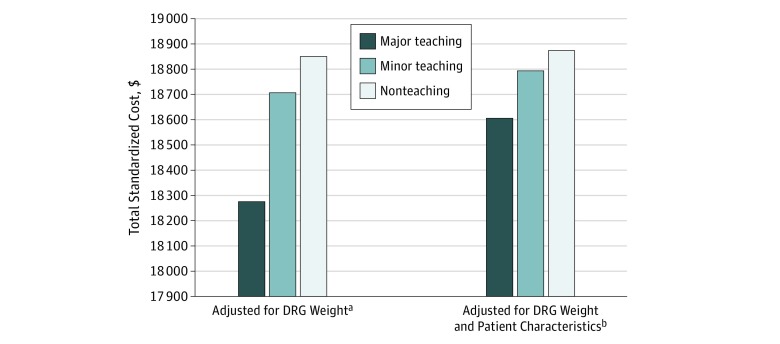
Figure 1. Total Standardized Costs Within 30 Days of a Hospital Admission by Hospital Teaching Status.
Total standardized costs for all hospitalizations for the 21 conditions in our sample (N = 1 249 006) are shown. The standardized cost method is described by the Centers for Medicare & Medicaid Services, in which each service is assigned a cost based on national Medicare payment rates without adjustments for wage index. Major teaching hospitals were members of the Council of Teaching Hospitals (COTH). Minor teaching hospitals had a medical school but no COTH affiliation. Nonteaching hospitals had neither COTH membership nor medical school affiliation. For the difference in costs between major and nonteaching hospitals in the model adjusted for diagnosis related group (DRG) weight, P < .001; in the model with patient characteristics added, P = .005.
aGeneralized linear regression model with a γ distribution for costs and a log link, incorporating DRG weight, principal diagnosis or procedure, and fixed effects of hospital referral region.
bModel further incorporates patient age, sex, Medicaid eligibility, and chronic conditions.

