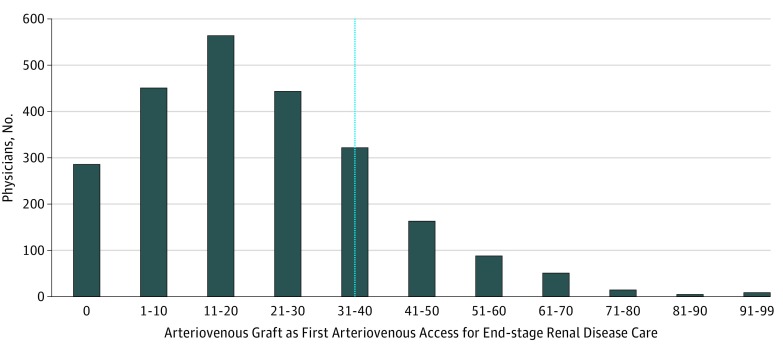
Figure. National Distribution of US Physicians by Their Arteriovenous Graft Use Rate.
Analysis excludes low-volume surgeons, defined as those performing less than 11 hemodialysis access procedures during the study period. The thin line indicates the 34% threshold used to define physicians who were outliers; all values to the right represent outlying arteriovenous graft use rates.

