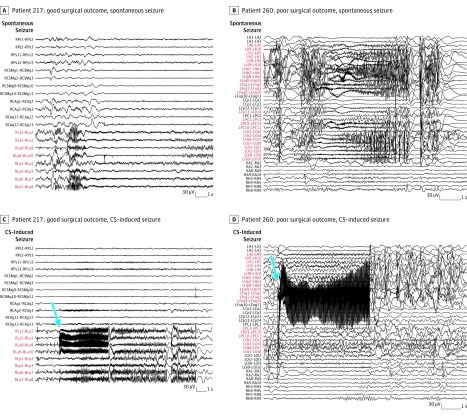
Figure 4. Comparison in Outcomes Between Spontaneous Seizure and Cortical Stimulation–Induced Seizure in 2 Patient Examples .
A and C, Stereoelectroencephalographic (SEEG) recording of patient 217, who had a good surgical outcome. B and D, SEEG recording of patient 260, with poor surgical outcome. Because of functional limitations, only part of the seizure-onset zone was removed in patient 260, as opposed to patient 217. Blue arrows point to the beginning of the cortical stimulation (CS). Contacts RLa 4-6 in patient 217 and contacts LFug 4-6 in patient 260 were stimulated (using 50 Hz). Even though the seizure-onset patterns show differences, the seizure-inducing channels (labeled in red) were similar. LA indicates left amygdala; LCp, left cingulate posterior; LFug, left fusiform gyrus; LH, left hippocampus; LHp, left hippocampus posterior; LOi, left occipital inferior; LOs, left occipital superior; LPC, left precuneus; RA, right amygdala; RCAg, right angular gyrus; RCSMg, right supramarginal gyrus; RH, right hippocampus; RLa, right lesional anterior; RLp, right lesional posterior; RPs, right parietal superior.

