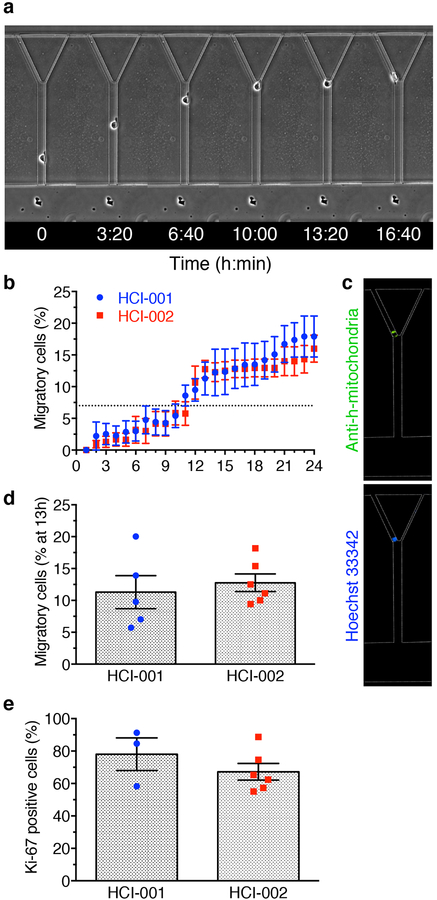
Fig. 5 |. MAqCI accurately predicts the metastatic potential of cells obtained from patient-derived xenografts.
a, Migratory HCI-002 cell entering left branch channel. b, Percentage of migratory cells for PDX cell lines. Data represent mean±SEM from n=5 independent experiments. Dotted line designates 7% migratory cells. c, Immunostaining for human mitochondria and nucleus performed after migration experiment. d, Percentage of migratory cells in HCI-001 and HCI-002 after 13h. Each data point represents the percentage from 1 experiment for n=5 independent experiments. Column and error bars represent mean±SEM. e, Percentage of Ki-67-positive cells in MAqCI. Each data point represents the percentage from 1 experiment for n≥3 independent experiments. Column and error bars represent mean±SEM.

