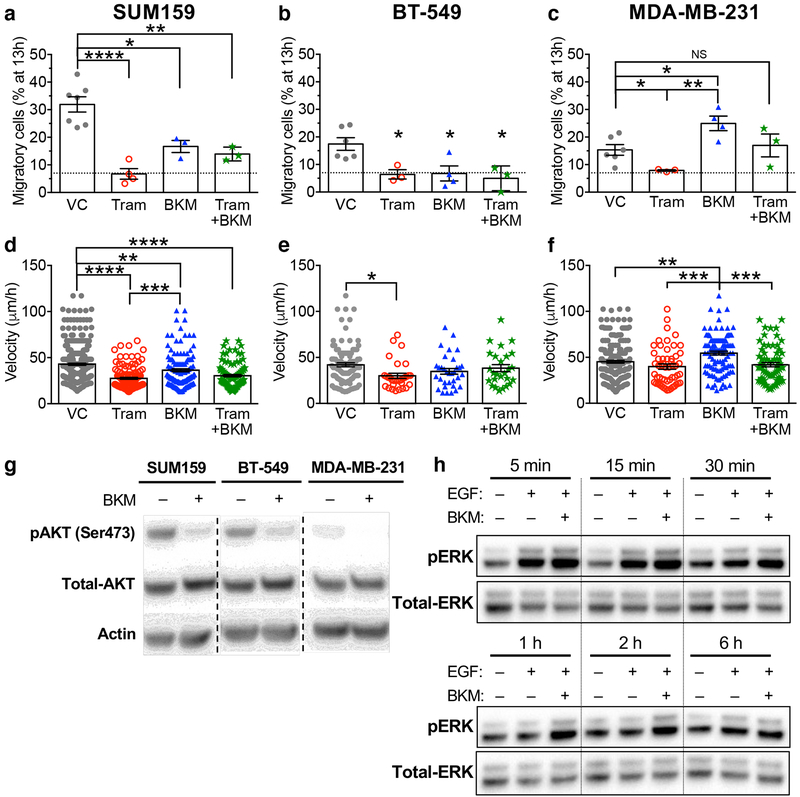
Fig. 6 |. MAqCI testing of therapeutic agents from ongoing clinical trials.
a, Percentage of migratory SUM159, b, BT-549 and c, MDA-MB-231 cells after 13h during treatment with vehicle control, BKM120 (1μM), trametinib (70nM), or BKM120 and trametinib. Dotted line designates 7% of migratory cells. Each data point represents the percentage from 1 experiment. Column and error bars represent mean±SEM of n≥3 independent experiments. d, Velocity of SUM159, e, BT-549 and f, MDA-MB-231 cells migrating in the feeder channel. P-values were calculated using one-way ANOVA followed by Tukey’s multiple comparison test. NS, p≥0.05; *, p<0.05; **, p<0.01; ***, p<0.001; ****, p<0.0001. Exact p-values are listed in Supplementary Dataset 3. g, Representative western blot for pAKT in SUM159, BT-549, and MDA-MB-231 cells treated with vehicle control or BKM120 (1μM) for 24h. h, Representative western blot for pERK in MDA-MB-231 cells serum-starved for 24h, treated with vehicle control or BKM120 (1μM) for 30min, then in select samples stimulated with EGF (100nM) for the indicated time. Western blot experiments were repeated n=3 times. Full scans of the cropped blots appear in Supplementary Fig. 7.

