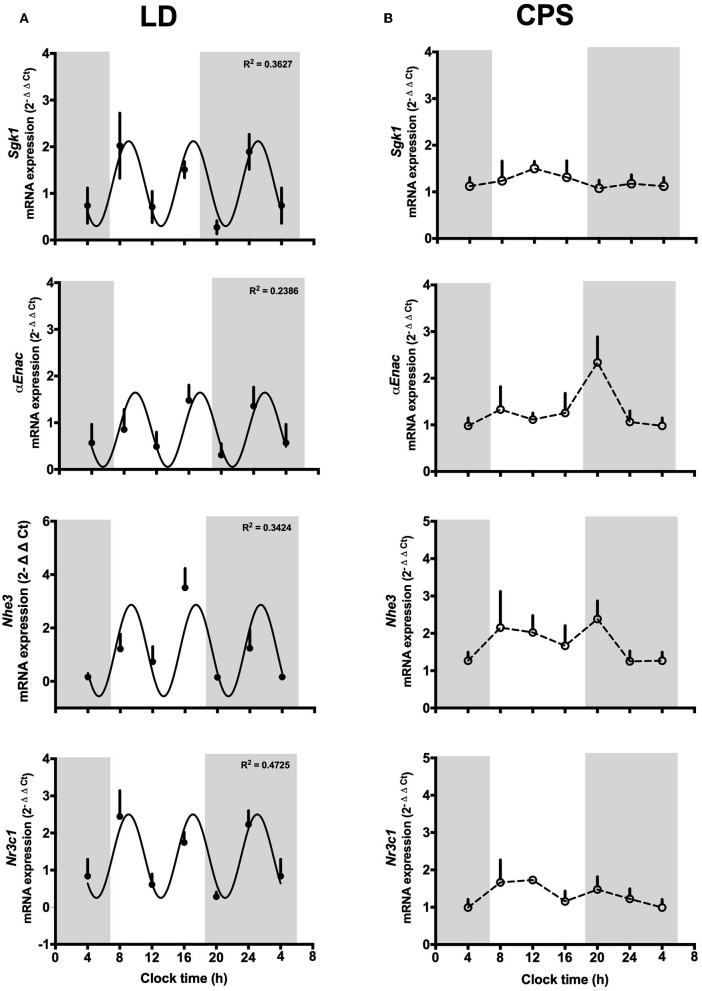
Figure 2.
(A,B) Fetal expression of genes related with renal function at 18 days of gestation. Fetal kidneys were collected every 4 h around the clock (n = 5/clock time; LD, n = 30 mothers; CPS, n = 29 mothers), starting at 08:00 h on day 18 and ending at 08:00 h on day 19 of gestation. Data are mean ± SEM. Solid lines represent the theoretical 8 h cosinor function in LD (SGk1: R2 0.3627, df 27; αENaC: R2 0.2386, df 23 NS; Nhe3: R2 0.3424, df 23 NS; Nr3c1: R2 0.4725, df 26) and dotted lines represent CPS kidney gene expression (R2 < 0.01 for all the genes evaluated). Gray bars indicate the clock time of lights off. P < 0.05 Pearson's r.

