
Figure 5.
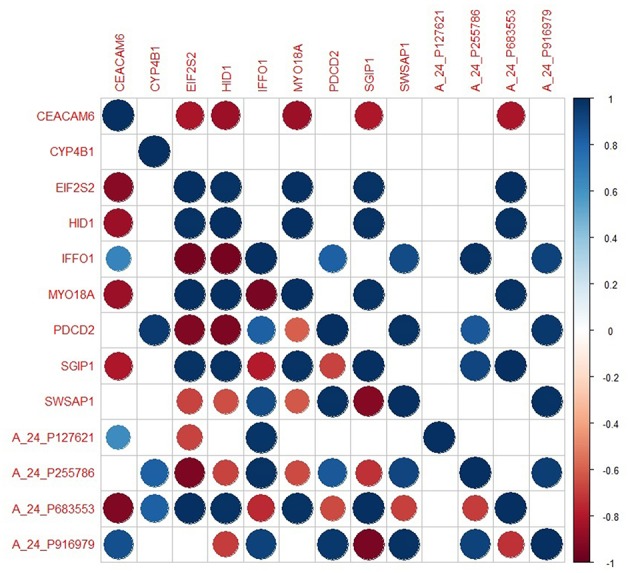
The degree of co-expression of core module genes between invasive and non-invasive states. Upper-triangle represents invasive state whereas lower-triangle shows non-invasive state.
Official websites use .gov
A
.gov website belongs to an official
government organization in the United States.
Secure .gov websites use HTTPS
A lock (
) or https:// means you've safely
connected to the .gov website. Share sensitive
information only on official, secure websites.
The degree of co-expression of core module genes between invasive and non-invasive states. Upper-triangle represents invasive state whereas lower-triangle shows non-invasive state.