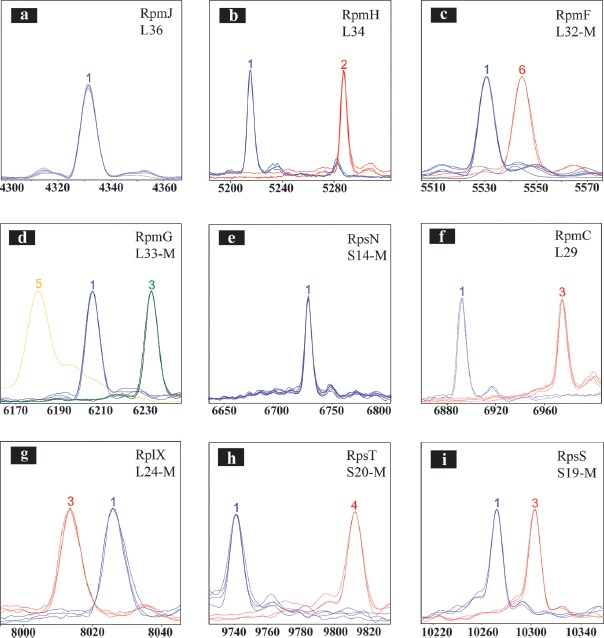
Figure 3.

Overview of C. fetus proteotyping biomarkers (a–i). To illustrate the observed mass differences of the allelic isoforms, spectra of different proteotyping-based sequence types were overlaid using the FlexAnalysis evaluation tool. X-Axis: mass [Da]–charge ratio, scale 200 Da. Y-Axis: intensity [10x arbitrary units]. For the graphical illustration, the peak intensity of high but respectively lower peaks was adjusted. Color code of the spectra: Spectra of strains with the isoform of C. fetus subsp. fetus reference strain LMG 6442 (NCTC 10842) are blue, whereas the differing isoforms are colored red, green, and yellow. If the N-terminal methionine of a ribosomal protein was cleaved, the respective illustration is provided with an “-M”
