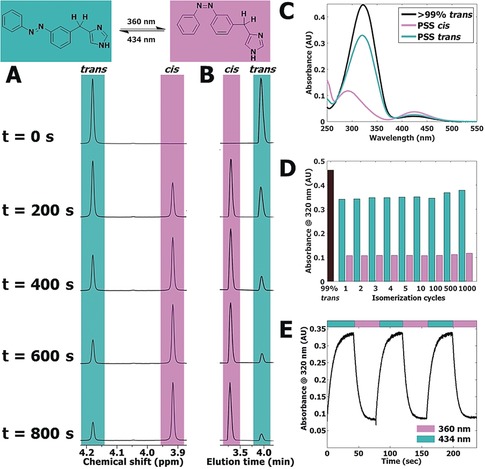
Figure 2.

A) Representative part of 1H NMR spectra of 10 mm 65 in [D6]DMSO illuminated at 360±20 nm displayed at various time points (seconds). The presented peak belongs to the hydrogen atoms explicitly drawn in the structure shown above the spectrum. Full spectra are available in Figure S4 in the Supporting Information. B) Representative part of LC‐MS chromatograms belonging to the illuminated NMR sample in Figure 2 A. Full chromatograms are available in Figure S5 in the Supporting Information. C) UV/Vis spectra of 25 μm of 65 in 50 mm Tris‐HCl pH 7.4 buffer + 1 % [D6]DMSO. PSS cis represents a sample which has been illuminated for 300 s using 360±20 nm light. PSS trans represents subsequent illumination for 300 s using 434±9 nm light. D) Repeated isomerization of 25 μm of 65 in 50 mm Tris‐HCl pH 7.4 buffer + 1 % [D6]DMSO analyzed at 320 nm. PSS cis was obtained by illuminating 65 for 40 s at 360±20 nm. PSS trans was obtained by illuminating 65 for 40 s at 434±9 nm. E) Absorbance at 320 nm of 25 μm of 65 in 50 mm Tris‐HCl pH 7.4 buffer + 1 % [D6]DMSO. UV/Vis spectra were obtained at 1 s intervals under alternating illumination at 360±20 nm and 434±9 nm perpendicular to the light source of the UV/Vis spectrometer.
