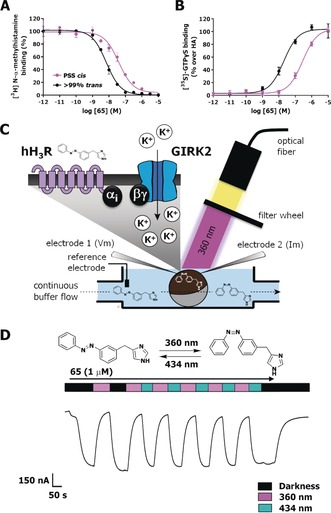
Figure 3.

Representative curves of 65 (A) in competition binding with [3H]‐NAMH or (B) in Gi protein activation, as measured by [35S]‐GTPγS accumulation on HEK293T cell homogenates transiently expressing hH3R. Black lines refer to a sample containing more than 99 % trans 65, while magenta lines refer to a sample of 65 illuminated to PSS cis with 360±20 nm prior to the assay. C) Schematic drawing of the TEVC setup used for dynamic hH3R and GIRK current activation in Xenopus laevis oocytes expressing hH3R and GIRK. D) Representative part of a GIRK‐mediated current trace during continuous perfusion with 1 μm 65, while illuminating the oocyte with alternating 360±20 and 434±9 nm wavelength, as measured by TEVC. Error bars shown are mean±SD.
