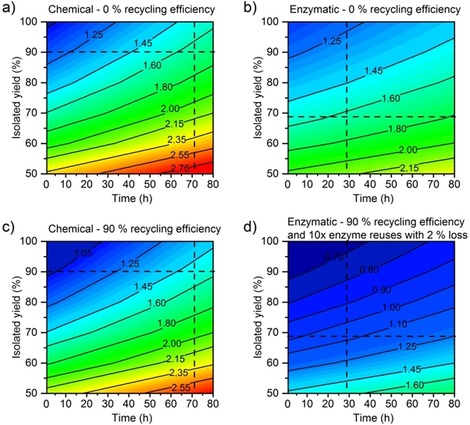
Figure 8.

Evolution of GWP (kg gproduct −1) as a function of the reaction time and the isolated yield for a) the chemical synthesis with m‐CPBA without recycling, b) the enzymatic synthesis without recycling, c) the chemical synthesis with m‐CPBA with 90 % recycling efficiency of solvents and co‐product, and d) the enzymatic synthesis with 90 % recycling efficiency of solvents and reuse of enzyme (10 cycles with 2 % loss). The intersection of the dotted lines indicates the current isolated yield and reaction time.
