Figure 3.

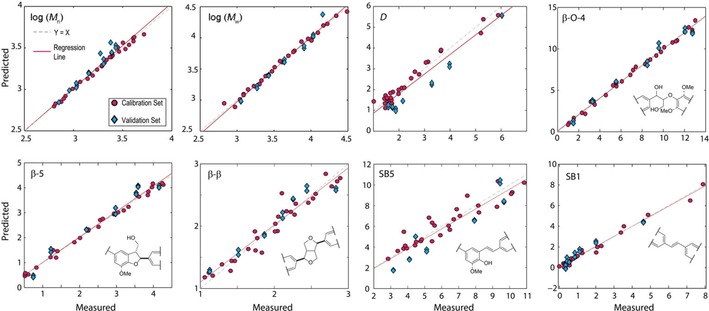
Scatterplots of measured versus predicted lignin properties based on PLS modelling. Inter‐unit abundances are measured and predicted on a per 100Ar basis.

Scatterplots of measured versus predicted lignin properties based on PLS modelling. Inter‐unit abundances are measured and predicted on a per 100Ar basis.