Figure 2.

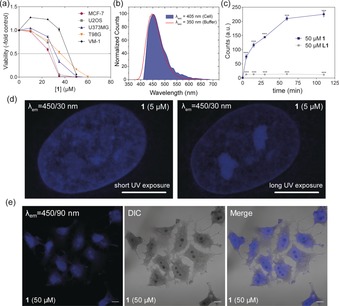
a) Cell viability assessed by MTT assay following exposure to 1 (0–50 μm). b) Normalized emission signatures of 1 in MCF‐7 cells acquired with confocal microscope (blue filled area) and in cell‐free buffer acquired with a spectrofluorometer. c) Flow cytometric analysis of U2OS cells treated with 50 μm of L1 (grey) and 1 (blue) over time (λ exc=405 nm, λ em=450/50 nm), p<0.001, 1‐way ANOVA, Bonferroni post‐test. d) Airyscan super‐resolution microscopy images of U2OS cells treated with 5 μm 1 at short‐ (10 ms) and long‐term (100 ms) exposure (λ exc=405 nm, λ em=450/30 nm) indicating selective photobleaching effects of 1. e) CLSM and DIC microscopy images acquired for PFA‐fixed MCF‐7 cells incubated for 30 min with 1 at 50 μm (λ exc=405 nm). Scale bars=10 μm.
