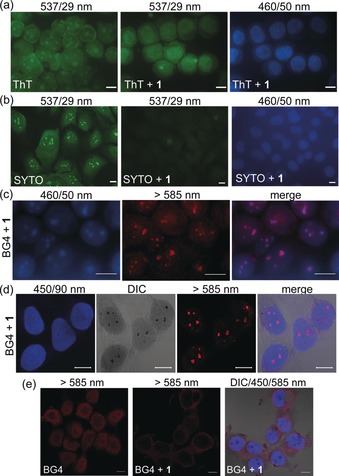
Figure 3.

a) Fluorescence microscopy images of MeOH fixed MCF‐7 cells, stained with ThT (5 μm) with and without 1 (5 μm) as indicated. Metallacycle 1 prevented ThT G4‐specfic nucleolar signals. b) Fluorescence microscopy images of U2OS cells stained with SYTO (500 nm), then fixed with MeOH and exposed to 1 (5 μm). c) Fluorescence microscopy images of MeOH‐fixed MCF‐7 cells co‐stained with BG4 and 1 (order: BG4, 1) after photobleaching. d,e) CLSM images of MeOH‐fixed MCF‐7 cells co‐stained with BG4 and 1 (order: BG4, 1) e) PFA‐fixed MCF‐7 cells co‐stained with 1 and BG4 (order: 1, BG4). Scale bars=10 μm.
