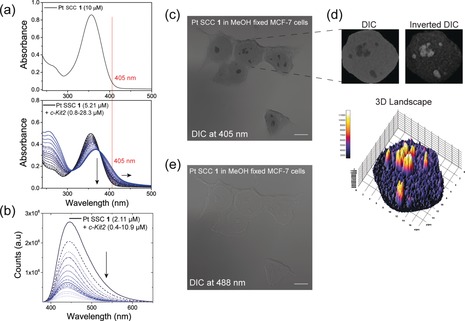
Figure 4.

a) UV/Vis absorption spectrum of 1 alone (up) and in combination with increasing amount of c‐Kit2 G4 solution (down). b) Fluorescence titration of 1 with c‐Kit2 G4. c) Image of MCF‐7 cells fixed with MeOH and incubated with 1 acquired using DIC mode at 405 nm. d) Differences in absorption within subnuclear regions of a representative 1‐treated nucleus derived from c) visualized by three‐dimensional surface plotting of single pixel intensities of the inverted DIC image. e) Image of MCF‐7 cells fixed with MeOH and incubated with 1 acquired using DIC mode at 488 nm. Scale bars=10 μm.
