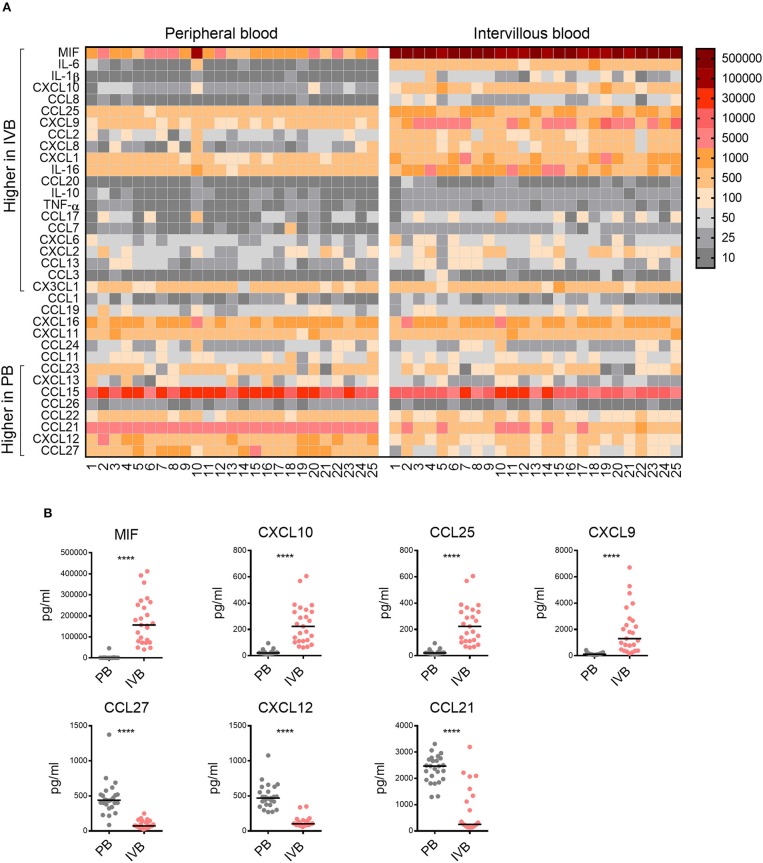
Figure 3.
Chemokine profile in intervillous blood is distinct from that of peripheral blood. (A) Heatmap displaying the levels of chemokines and cytokines (pg/ml plasma) in all individual samples of peripheral (PB) and intervillous blood (IVB) (n = 25). The brackets indicate significant differences between PB and IVB. Numbers indicate individual donors. (B) The levels of MIF, CXCL10, CXCL9, and CCL25 were significantly higher in IVB compared to PB, whereas the levels of CCL27, CXCL12, and CCL21 where significantly lower. Line in graphs represents the median. Comparisons between paired samples were made using the nonparametric Wilcoxon test. ****p < 0.0001.

