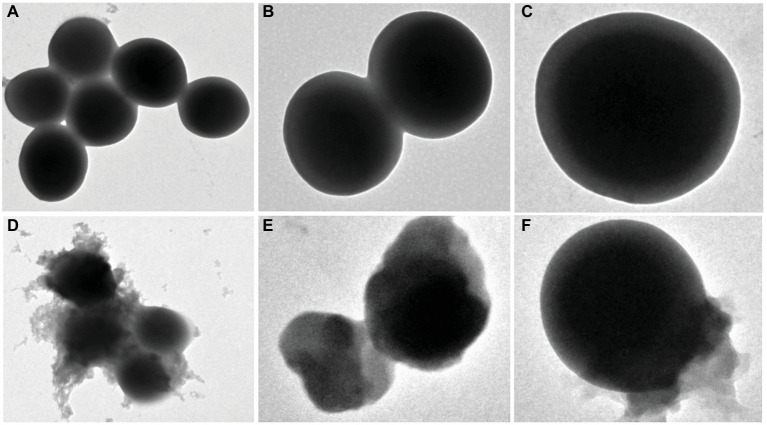
Figure 3.
Scanning electron microscopy analysis of S. aureus treated with and without EtOAc fraction of D. moldavica L. ethanol extract. Images (A) and (D) were observed at an instrumental magnification of 10,000×; images (B) and (E) at an instrumental magnification of 20,000×; images (C) and (F) at an instrumental magnification of 60,000×. (A–C) D. moldavica L. extract group. (D–F) Control group.

