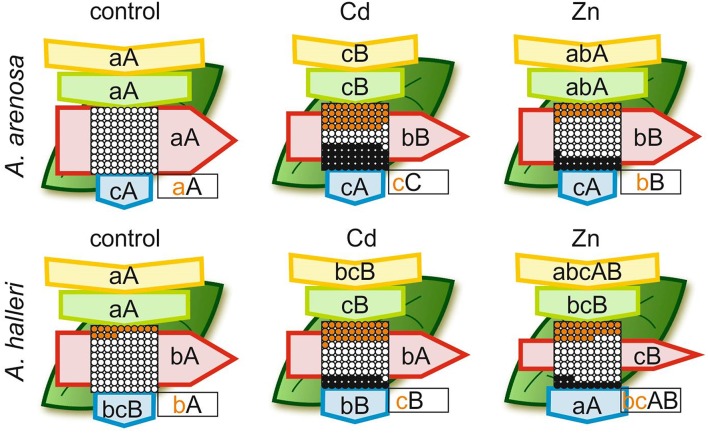
Figure 6.
Leaf model showing the phenomenological energy fluxes per the excited cross sections (CS) of the leaves of the A. arenosa and A. halleri at the end of experiment (120 h). Cd−1.0 mM Cd treatment; Zn−5.0 mM Zn treatment. Each relative value of the measured parameters is the mean (n = 20) and the width of each arrow corresponds to the intensity of the flux. Yellow arrow—ABS/CS, absorption flux per CS approximated; green arrow—TR/CS, trapped energy flux per CS; red arrow—ET/CS, electron transport flux per CS; blue arrow—DI/CS, dissipated energy flux per CS; circles inscribed in squares—RC/CS, % of active/inactive reaction centers. White circles inscribed in squares represent reduced QA reaction centers (active), black (or orange) circles represent non-reduced QA reaction centers (inactive), 100% of the active reaction centers responded with the highest mean value observed in the control conditions. Orange circles present the difference in % of inactive RC between A. arenosa and A. halleri. Means followed by the same letter for each parameter in a row (upper case letters) or in a column (lower case letters) are not significantly different from each other using the Tukey HSD test (P < 0.05). Letters are inscribed into arrows, except for RC/CS, where they are placed in a box in the bottom right corner of the square with circles. Lower case letters describe statistical differences between species in all treatments, upper case letters describe changes for each species during experiment. Orange lower case letters describe statistical differences in RC/CS between species under each HM treatment.

