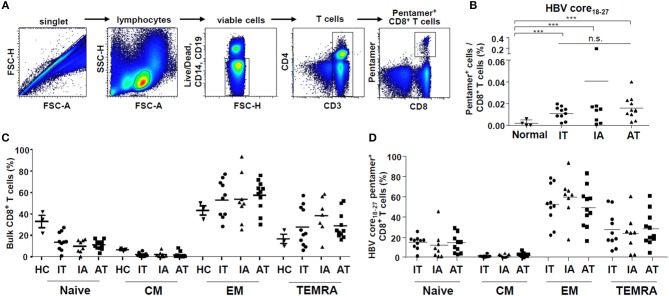
Figure 1.
Proportion of ex vivo HBV core18−27-specific CD8+ T cells in the patient cohort. (A) Gating strategy for quantification of HBV core18−27-specific CD8+ T cells using flow cytometry. (B) Proportion of HBV core18−27-specific CD8+ T cells as determined using flow cytometry in normal controls and patients in the IT, IA, and AT groups (normal: n = 4, IT: n = 10, IA: n = 8, AT: n = 11). ***P < 0.001. (C,D) Proportions of naïve (CCR7+CD45RA+), central memory (CCR7+CD45RA−), effector memory (CCR7−CD45RA−), and effector memory RA (CCR7−CD45RA+) T cells in bulk and HBV core18−27-specific CD8+ T cells from the IT, IA, and AT groups. AT, antiviral treatment; CCR7, chemokine receptor 7; CM, central memory; EM, effector memory; HBV, hepatitis B virus; HC, healthy control; IA, immune-active; IT, immune-tolerant; TEMRA, effector memory RA T cell.

