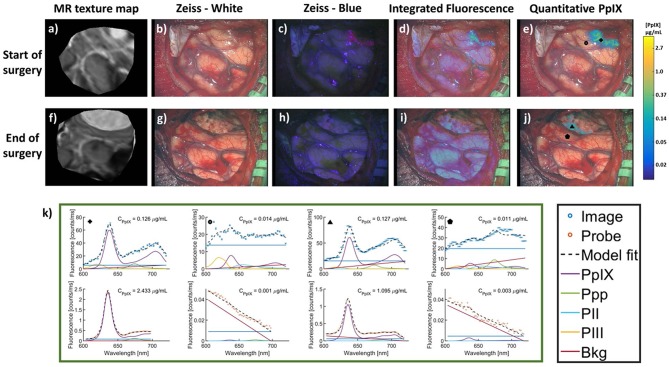
Figure 6.
MR images and intraoperative fluorescence using a filter corrected approach. Images were acquired at the start (top row) and end (bottom row) of surgery. (a,f), MR images corresponding to the intraoperative (b,g) conventional white light images, (c,h) blue light vFI images using a commercial microscope system, (d,i) “raw” fluorescence intensity, or integrated fluorescence images, and (e,j) quantitative fluorescence images using a ratiometric and filter correction approach. (k) PpIX spectra using the qFI system (top row) and spectroscopic quantitative probe (bottom row) at multiple locations and timepoints during surgery [marked by corresponding symbols in images (e,j)]. PpIX concentration observed in the CPpIX overlays. Ppp, Photoproduct I; PII, Photoproduct II; PIII, Photoproduct III; Bkg, Background; Offset, linear offset for background signal. Figure adapted with permission from Bravo et al. (38).

