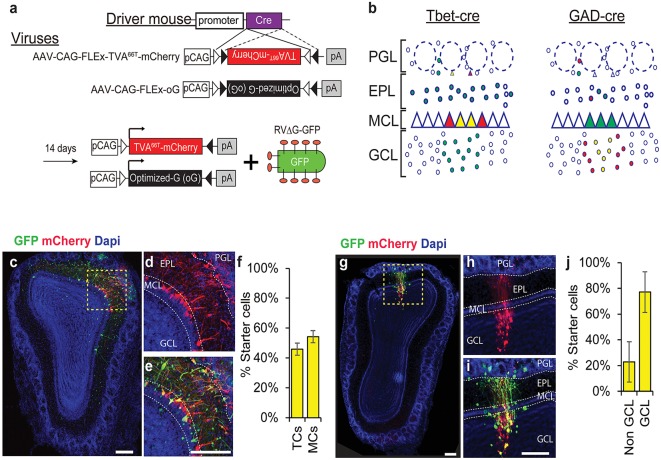
Figure 1.
Rabies trans-synaptic tracing of mitral and tufted cells (M/Ts) and interneurons (INs) in the olfactory bulb (OB). (A) A schema of the adeno associated viral (AAV) vectors used in our experiments. The tumor virus receptor A (TVA)66T and the envelope glycoprotein—oG are designed in a cre dependent manner (top). Injection of the AAV into a cre expressing mouse induces recombination and expression of TVA66T and oG in a cell-specific manner. A pseudotyped rabies virus expressing GFP (RV-ΔG-GFP) is then injected to the same location in the OB to reveal the pre-synaptic landscape of the previously infected neurons. (B) Illustration of two different cre expressing driver mice and their expected result after injection of all the rabies components. Tbet-cre mice are expected to have starter cells (yellow) and mCherry (red) expressing neurons in M/Ts and their input cells should be green only (left). In GAD-cre mice, yellow and red cells should be restricted to INs (right). Only the local circuitry is shown for clarity. (C) Photomicrograph showing a coronal section of an OB slice after injecting the AAVs and RV into a Tbet-cre mouse. (D) Inset of the area marked in “C” showing the mCherry channel. Notice that mCherry expression is restricted to the MCL and juxta-glomerular area, indicating the specificity to M/Ts cells. (E) Magnified view of the inset in “C”. Yellow starter cells are detected as M/Ts cells. (F) Quantification of the number of starter cells in Tbet-cre mice, representing tufted cells (TC) and mitral cells (MCs) separately. (G–J) Same as “C–F” but for GAD-cre mice, where INs are now the starter cells. Scale bars −200 μm. PGL, periglomerular layer; EPL, external plexiform layer; MCL, mitral cell layer; GCL, granule cell layer.

